In consumer packaged goods (CPG), the difference between winning and losing is often razor thin. A single promotional campaign, a seasonal SKU launch or even a small competitor push can tip the balance. That’s why Share of Shelf (SoS) has become one of the most important metrics in shelf execution.
It’s not just another KPI to tick off. In today’s hyper-competitive environment, a half-percent swing in SoS can mean millions in revenue gained or lost. The challenge? Measuring it accurately, in real time, across thousands of stores.
What Is Share of Shelf and Why It’s Strategic
Share of Shelf measures the proportion of space a brand occupies compared to competitors within a category. On paper, it’s simple. In practice, it’s the frontline of market share:
- Higher visibility drives sales velocity. Products seen more often get picked more often.
- Shelf presence reinforces brand dominance. A consistent position signals leadership to both shoppers and retailers.
- Retailer negotiations hinge on it. Demonstrating SoS uplift gives brands leverage in trade discussions.
In short, SoS is the most visible expression of competitive performance at the point of sale.
The Problem with Measuring SoS Today
For decades, brands relied on manual audits and legacy image recognition tools to track SoS. But these methods fall short in three key ways:
- Too slow: Data arrives weeks after the fact, by which time the shelf has changed.
- Too narrow: Sample-based tracking misses the true picture across geographies and channels.
- Too error-prone: Legacy IR models need retraining for every SKU change, making data inconsistent.
The result? HQ teams make big commercial decisions on incomplete or outdated data. Field reps miss execution gaps in the moment. And competitors quietly eat into shelf share while brands are left guessing.
Why Measuring Share of Shelf Is So Complex
Calculating SoS might sound simple, just count facings and percentages, but real-world shelves are messy and dynamic. A robust IR solution has to account for:
- Shelf variability: different store formats, layouts and fixture types.
- Product similarity: SKUs that look nearly identical, especially in categories like beverages or personal care.
- Obstructions: products blocked by others, price tags or promotional signage.
- Lighting and angles: poor photo quality or inconsistent conditions from store to store.
- Constant change: new SKUs, seasonal packs and retailer-specific packaging hitting shelves weekly.
Most legacy IR solutions rely on huge volumes of real shelf photos to train models for these scenarios. That makes them slow to adapt, fragile when conditions change and limited in scalability.
“We tried countless different approaches to understanding what drives growth. In the end, for us, SoS is the core metric. SoS even goes as far to replace our traditional segmentation approaches.”
— VP Digital Sales & Operations, Global Beverage Company
The Neurolabs Difference: Synthetic Data + Digital Twins
Neurolabs tackles this complexity differently. Instead of waiting for real-world shelf photos, we use synthetic data and digital twins of products to train models.
This means we can instantly recognise SKUs without the bottleneck of data collection. The result:
- Faster – onboard new SKUs in minutes.
- More accurate – +96% recognition accuracy even in cluttered, variable conditions.
- More scalable – consistent measurement across categories, markets and languages, without retraining.
In other words, we’ve solved the hardest part of measuring SoS, making it reliable enough to be a true commercial lever.
The Half-Percent Battle Explained
Why does half a percent matter? In a $5bn category, a 0.5% swing in shelf presence could mean $25m in annualised sales impact.
That’s the scale at stake when competitors secure one extra facing, seasonal SKUs push core lines aside, or execution lapses go unchecked. Small shifts add up fast which is why SoS is one of the most fiercely contested KPIs in CPG.
How Visual AI Redefines SoS Measurement
This is where image recognition and Neurolabs’ ontology-led approach change the game. Instead of relying on field photos or manual retraining, Neurolabs builds digital twins of products and shelves.
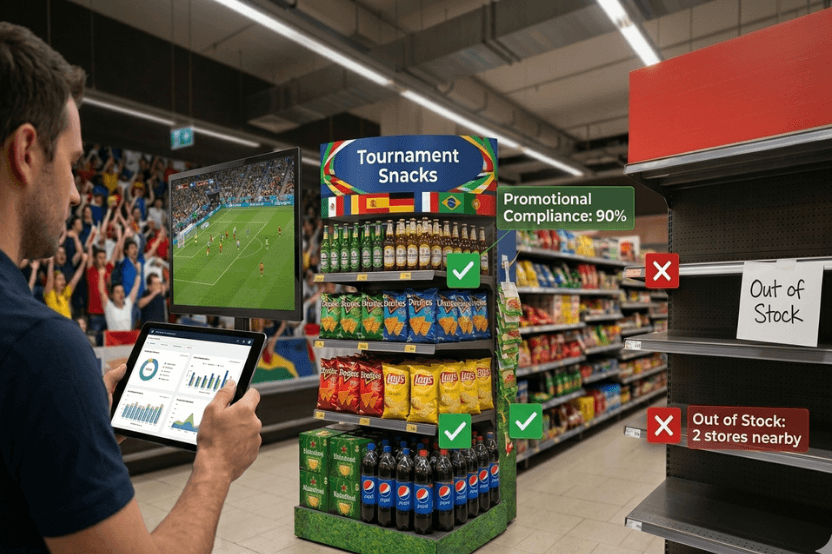
With one photo, brands get a complete, structured view:
- Exact SoS percentage across categories
- On-shelf availability
- Promo and price compliance
- Competitor presence and pricing
Our ontology layer converts raw pixels into actionable KPIs. This means brands can measure SoS consistently, across markets, with 96%+ accuracy, no matter how many SKUs, promotions or languages are in play.
Global CPGs already use this to:
- Scale execution across thousands of SKUs without bottlenecks
- Cut audit time by 50% (see our AG Barr case study)
- Turn data into real-time action for reps in store
From KPI to Growth Lever
When SoS is measured accurately and at speed, it stops being a reporting metric and starts becoming a growth lever. Brands can:
- Optimise trade spend by tying SoS to actual ROI.
- Strengthen retailer negotiations with concrete evidence of execution gaps.
- Prioritise field actions by directing reps to the stores where small SoS changes mean big commercial wins.
In this way, SoS becomes not just a performance indicator, but a decision-making tool that drives measurable growth. It links directly to the broader retail execution strategy outlined in our Four Strategic Levers of Retail Execution in 2025.
Winning the Half-Percent Battle
Share of Shelf isn’t marginal, it’s mission critical. The half-percent battle defines who leads categories and who gets left behind.
With Neurolabs, brands can finally measure SoS with the speed and accuracy this battle demands, transforming it from a lagging KPI into a proactive lever for growth. Just ask AG Barr, one of the UK’s most iconic drinks manufacturers and the makers of IRN-BRU, who cut audit time by 50% while boosting execution quality.
If you’re ready to stop leaving shelf space (and revenue) on the shelf, now’s the time to act. Book a demo today and see how we can help you win the half-percent battle, every store, every day.
.png)
%20(1).png)