

How to Calculate Share of Shelf: Facings, Linear Space and the Rules That Change the Number

November 9, 2026
Share of shelf is one of the most common perfect store KPIs and one of the most argued about. Two teams can photograph the same shelf and report different numbers because they count differently. Before you debate the score, agree the formula and the rules.
If you want the commercial case for why share of shelf matters, start with the half-percent battle in modern CPG. This article is about how to calculate it.
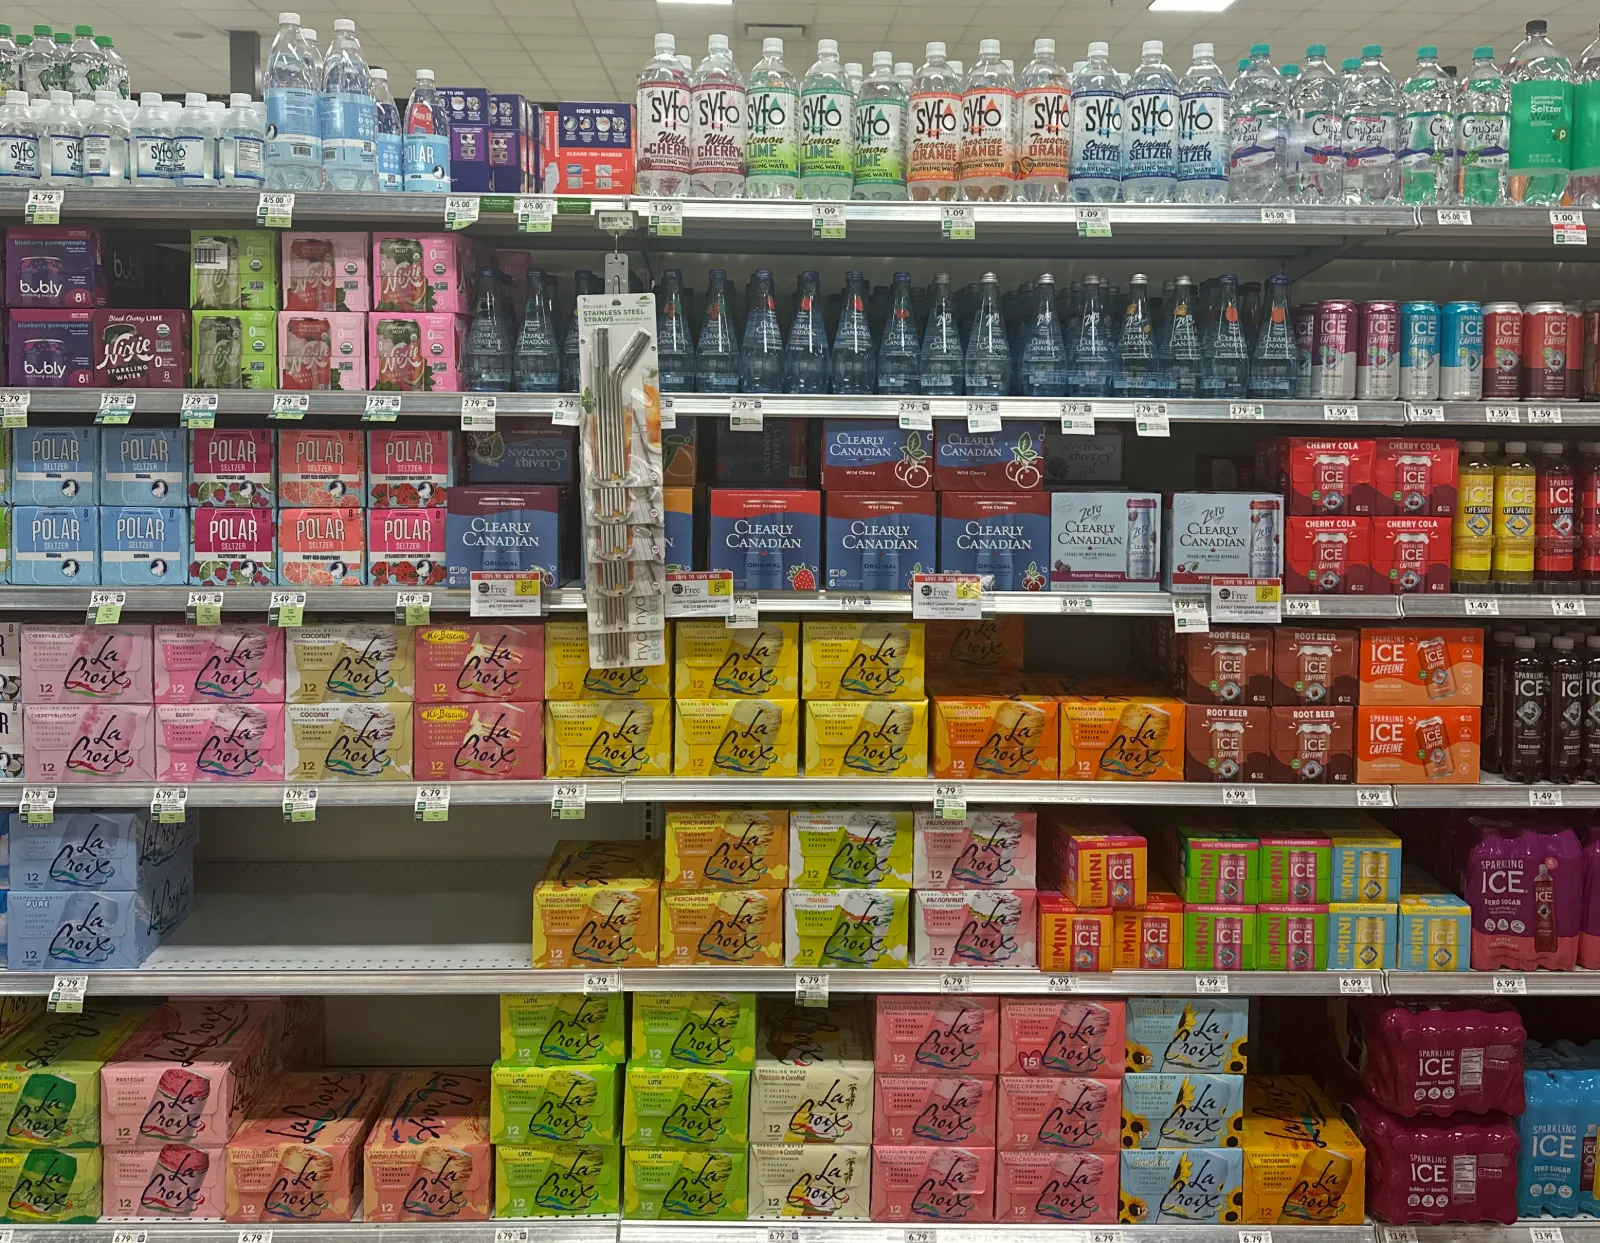
The share of shelf formula
There are two standard ways to calculate share of shelf.
Facings share of shelf
Example: your brand has 12 front facings in a bay with 60 facings of the category in total. Facings share of shelf is 12 ÷ 60 × 100 = 20%.
Facings share is quick to count and easy to explain to the field. Its weakness is pack size. A large multipack and a single can each count as one facing, even though one takes up far more space.
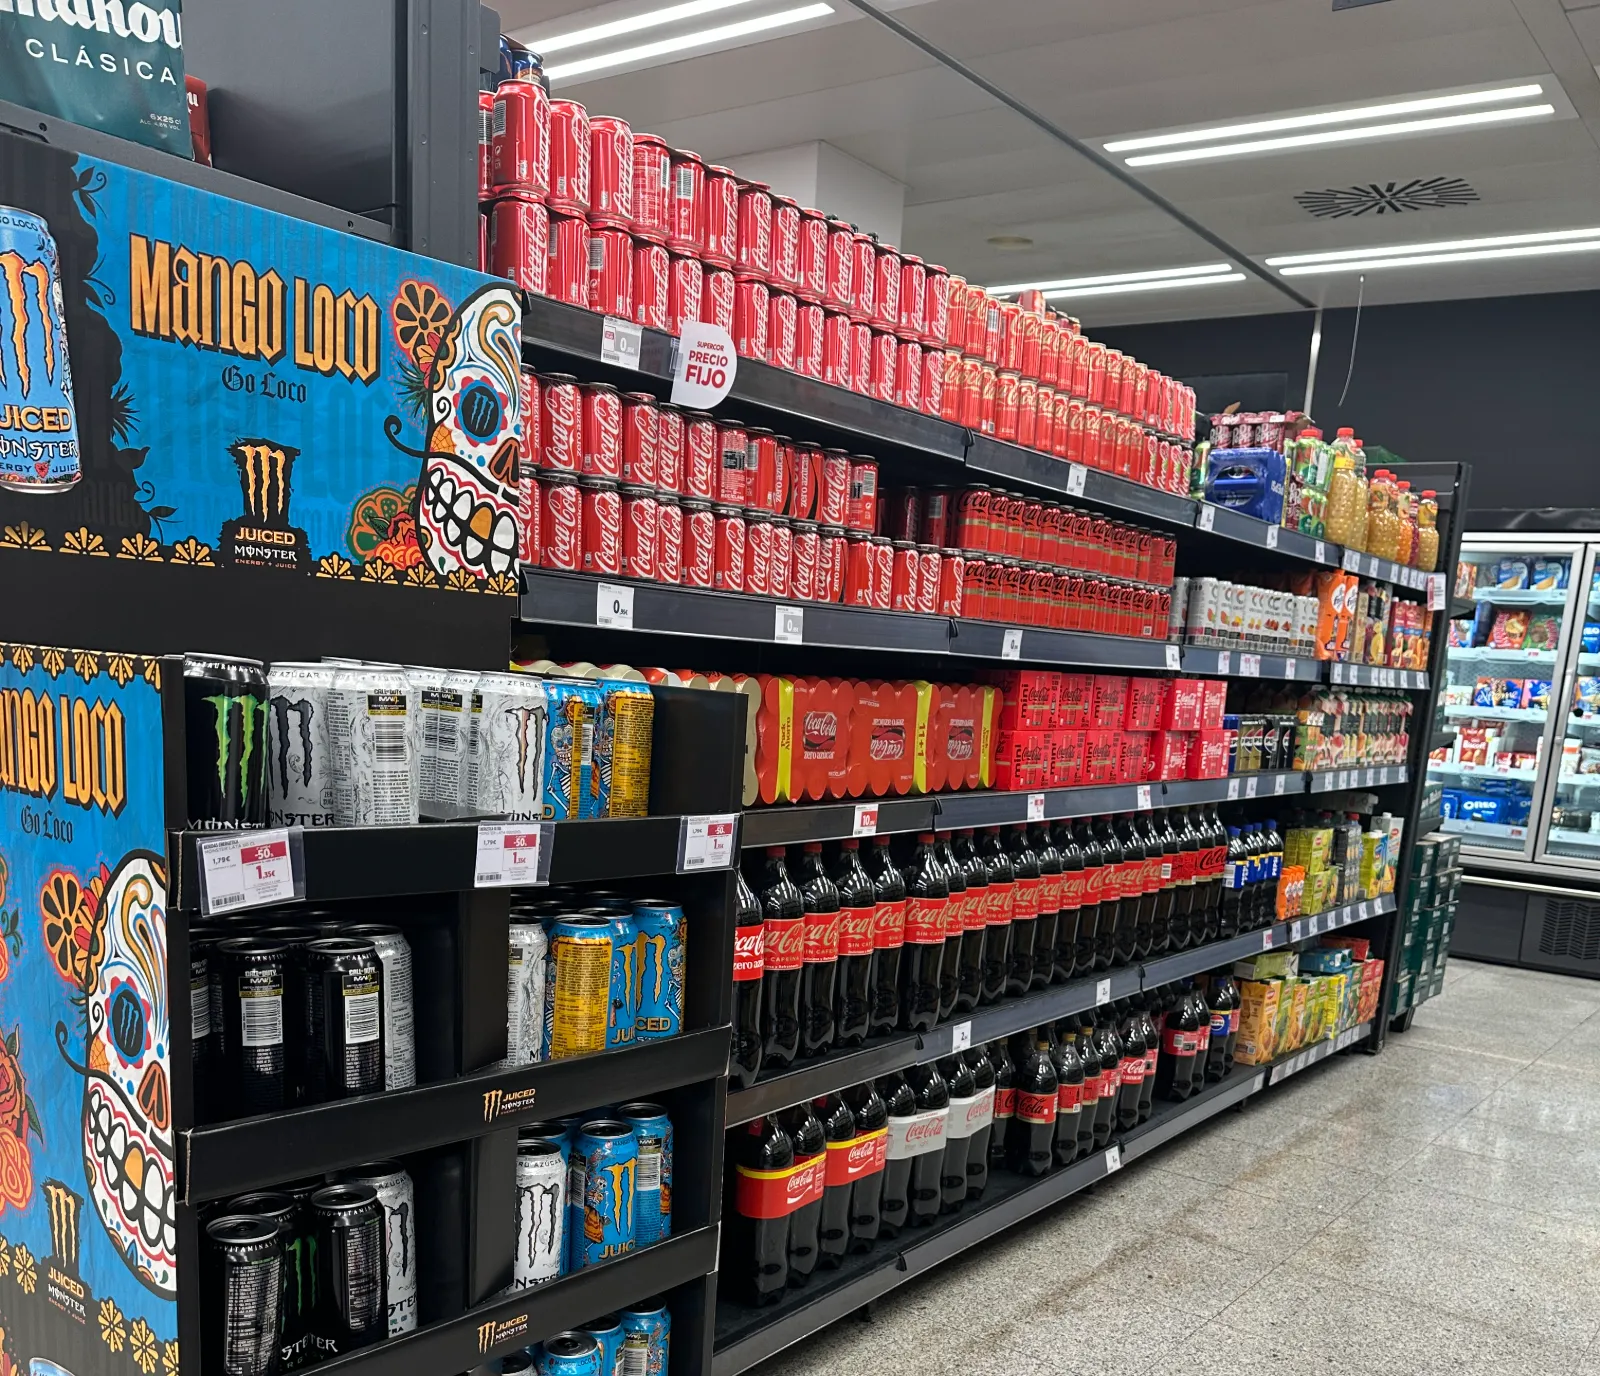
Linear share of shelf
Example: your products occupy 1.8 metres of a 7.2 metre category run. Linear share of shelf is 1.8 ÷ 7.2 × 100 = 25%.
Linear share reflects what the shopper actually sees, so it is fairer when pack sizes vary. It is harder to measure by hand which is why many teams default to facings.
Some brands track both. One confectionery brand we spoke to calculates facings share and linear share for every visit, across all the photos taken in that visit rather than photo by photo.
The counting rules that change the number
The formula is simple. The rules behind it decide whether your number is comparable across stores, reps and markets. Write these down:
- Front facings only? Most teams count only the front row. One frozen food brand excludes anything stacked on top.
- How do empty facings count? The same brand treats a gap in its space as out of stock, not as lost share. Pick one rule.
- Where does the category start and end? On mixed shelves, category boundaries blur. One sauces brand told us its products share bays with unrelated categories, so it tracks competitor facings by SKU instead.
- Which competitors count? Several teams measure share against named competitors rather than the whole category.
- Does the rule change by channel? Wholesale, modern trade and convenience often need different rules. Say so in the standard.
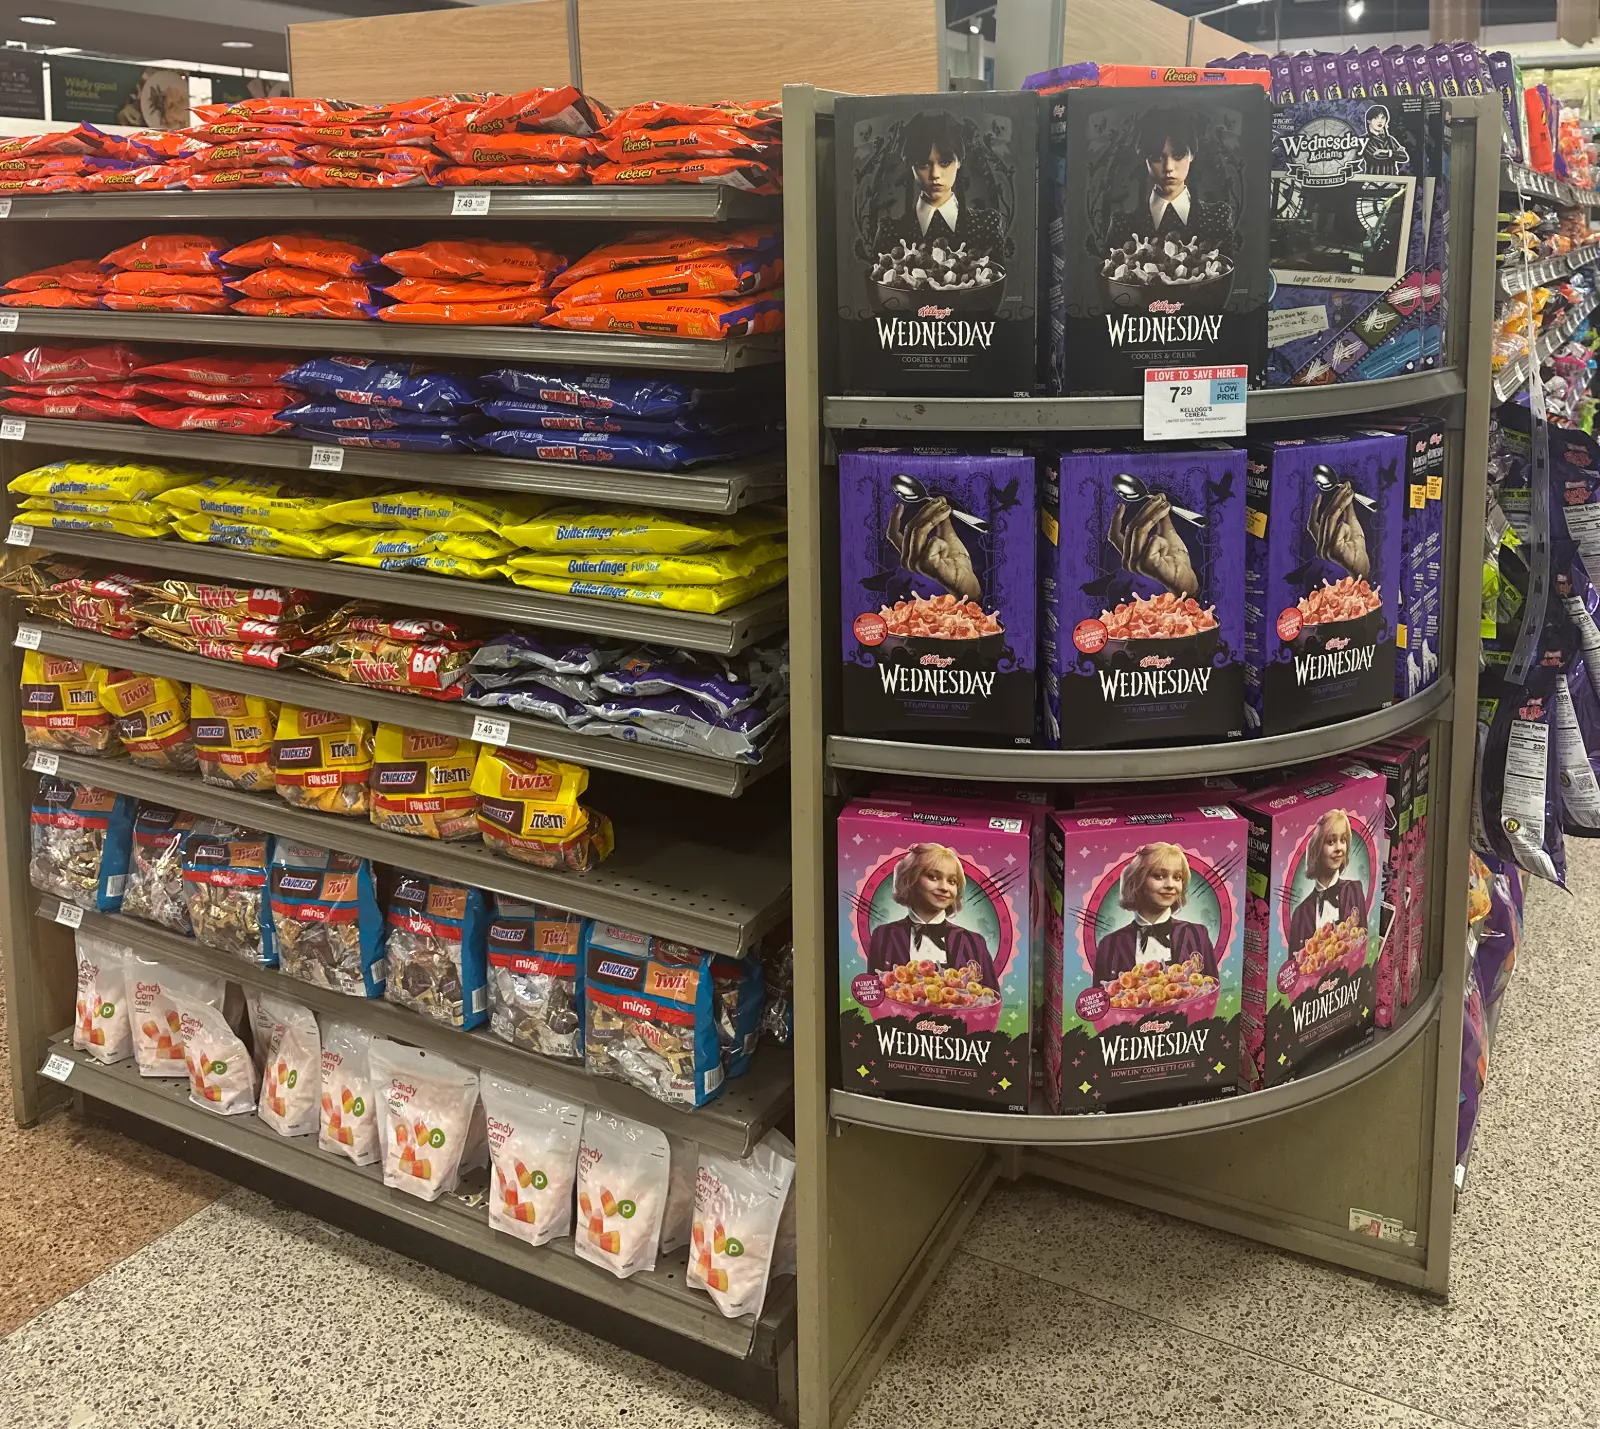
Share of shelf vs fair share
Share of shelf on its own does not tell you if your space is right. Compare it with your value share of the category.
If your share of shelf is 20% and your value share is 25%, your index is 80. You are under-spaced for what you sell, which usually means more out of stocks and less visibility. An index well above 100 is a risk at the next range review.
Setting targets
Targets work best by segment, not just by category. One spirits brand requires 80% or more of facings in its premium vodka segment. Today its reps count those facings by hand, one by one, in every store.
How to measure share of shelf at scale
Counting facings by hand is slow and inconsistent. Image recognition reads every facing in a shelf photo, applies the same counting rules every time and returns facings and linear share per brand, per SKU and per competitor. The rep takes the photo and the rules do the rest.
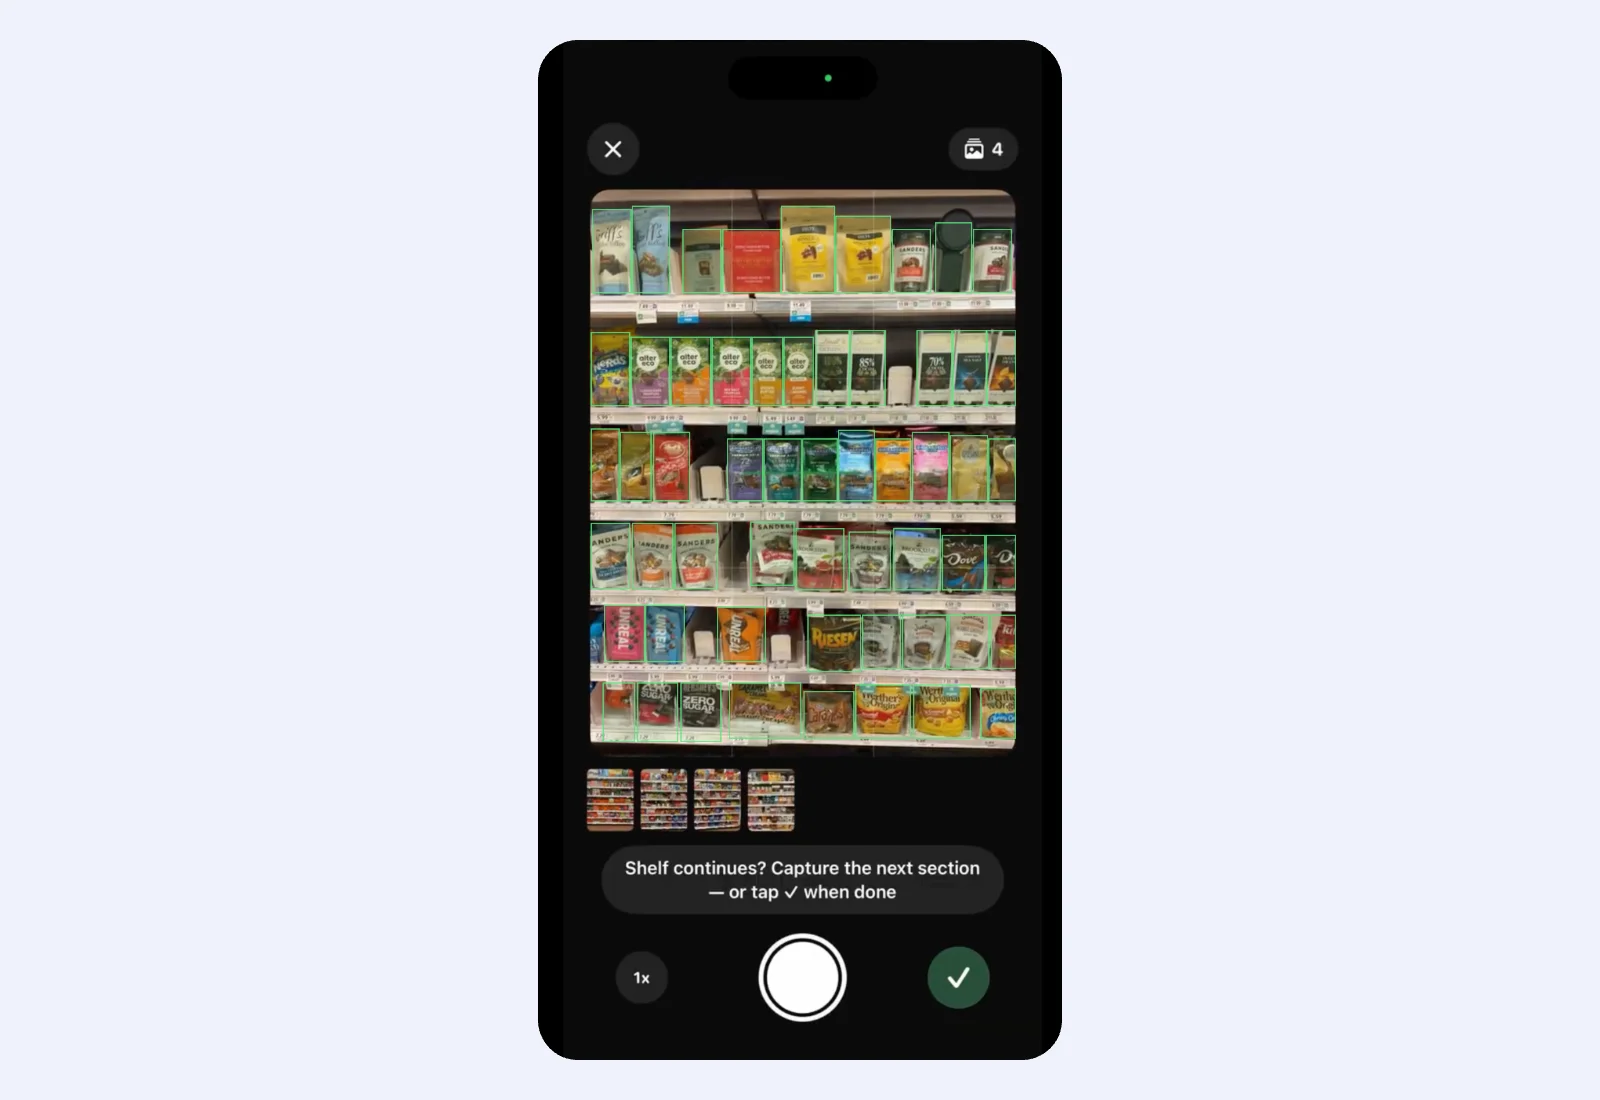
The bigger gain is time. A share loss after a competitor reset, spotted the same week, can be raised with the store while it still matters.
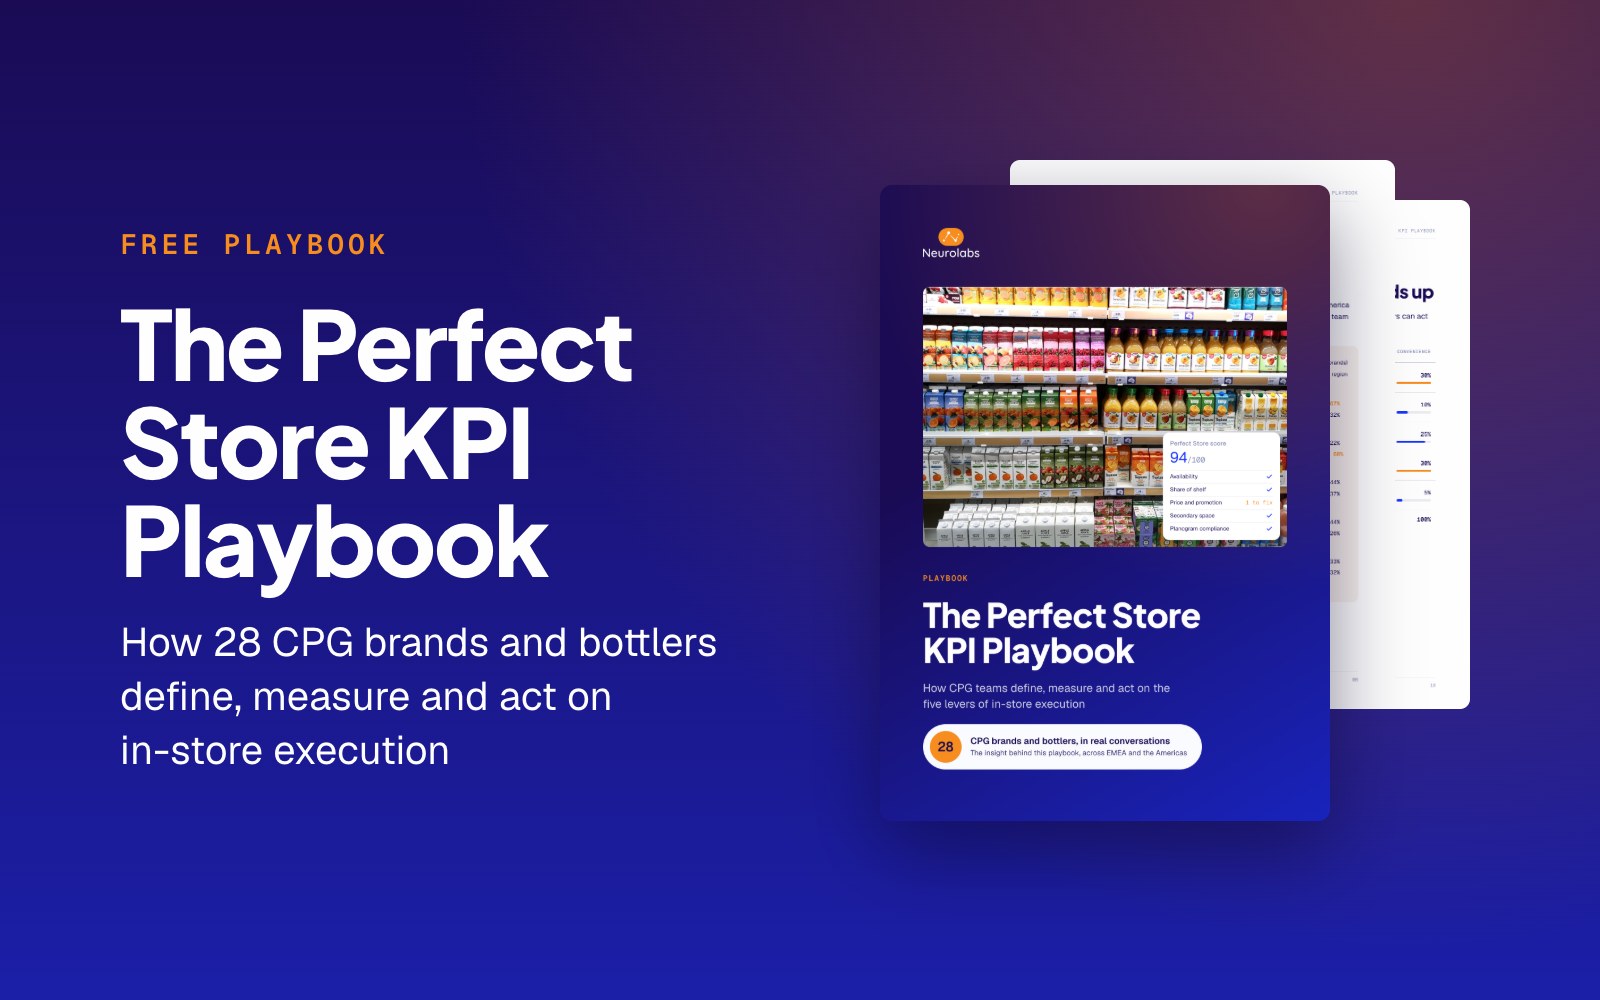
Share of shelf is one of five perfect store levers. The Perfect Store KPI Playbook covers all five, with formulas, counting rules and a scorecard template drawn from 28 CPG brands. Download the playbook.
FAQ
What is the share of shelf formula?
Facings share of shelf is your facings divided by total category facings, multiplied by 100. Linear share of shelf uses shelf length instead of facings.
Is facings or linear share of shelf better?
Linear share is fairer when pack sizes vary. Facings share is simpler to count. Many brands track both and use one as the headline.
What is a good share of shelf?
It depends on your share of sales. A good starting point is a fair share index close to 100, meaning your share of shelf matches your value share of the category.

Related Resource


Get the latest Execution Intelligence news and resources direct to your inbox
Industry insights, retail intelligence and field-tested execution playbooks, so you always know what's happening in store.



© 2026 Neurolabs. All rights reserved

