.svg)

The Execution Gap in Europe: nobody measures it the same way twice

October 1, 2026
The question you can't answer
Right now, across your European portfolio, one market is losing you more money to failed execution than any other.
Which one?
Most commercial leaders can't answer that and it isn't because nobody is measuring. Europe is one of the most heavily measured retail regions on earth. Every market you operate in produces execution numbers every month, from a field team or an agency or a panel.
The problem is that you can't put those numbers next to each other and learn anything from the comparison and once you can't compare them, trade investment stops following the gap and starts following market size instead.
To see why that happens, it helps to start somewhere much simpler than execution.
The table that doesn't exist
Let's start with a question that should be a lookup. Which of my European markets is most consolidated?
It isn't a lookup. Here's what you actually find when you go to the source each country publishes.
Great Britain gives you a household panel. Worldpanel by Numerator, 12 weeks ending 9 August 2026: Tesco 27.8%, Sainsbury's 15.2%, Asda 11.5%, Aldi 10.7%, Lidl 8.8%. Top five, 74.0%. That's built from what a demographically representative sample of British households actually spent on take-home groceries. M&S Food isn't in it because Worldpanel doesn't classify M&S as a grocer under its definition.
Norway gives you something that looks the same and isn't. The Norwegian Competition Authority, 2025: NorgesGruppen 43.5%, Coop 29.2%, REMA 1000 24.0%, Bunnpris 3.4%. Its own footnote is the cleanest admission you'll find anywhere: the four companies' shares summed to 99.9% in 2024 and 100.1% in 2025. Those four aren't just the market leaders, they're the denominator.
Germany doesn't give you a share at all. There's no free consumer panel. What exists is a revenue ranking: Lebensmittel Praxis, using NIQ Trade Dimensions data for 2025, has EDEKA at €84.7bn, REWE €70.6bn, Schwarz Gruppe €61.3bn, Aldi €36.9bn. Those are euros, not percentages. For concentration you go to the Bundeskartellamt, which has put the big four at roughly 85% of German food retail, a figure the Bundestag research service restated in September 2024.
It carries on like that across the rest.
Eight markets, four fundamentally different kinds of number. Only Great Britain, Ireland, Spain and France are built on the same Worldpanel methodology. Those four you can line up against each other while the other 26 markets you cannot.
Put Sweden's ICA at 50.6% next to Britain's Tesco at 27.8% and Sweden looks twice as concentrated. Some of that is real. A meaningful part of it is that one number is a share of a closed list of companies and the other is a share of what households spent. Ranking them against each other is not analysis.
Now apply that to your own execution data
Everything above is just retailer share. It's the easiest thing in retail to measure and professionals measure it in every market but it still doesn't produce one comparable number.
Your execution data is harder than that and it's built the same way, market by market, by different people, to different definitions.
Different retailers, different planogram logic, different definitions of what counts as compliant. Different capture methods, different reporting cycles, different field agencies, each with its own standard. Every country produces a number but no two numbers mean the same thing.
What reaches head office is an average of measures that were never comparable and that average is not a weak signal, it's just not a signal at all.
Which produces the expensive part. Trade investment gets allocated by market size because market size is the one variable head office can compare with confidence. It should be allocated by where the execution gap is widest. Without comparable data nobody can tell the difference so the gap keeps getting funded at exactly the rate it always was.
This is also why a European brand can be genuinely good at execution in one market and still be at Level 0 as a region. On the Execution Maturity Ladder, Germany might be running at Level 4, with rules replacing rep discretion at the shelf. The UK might be close behind, Poland might be at Level 1, on lagged third-party audits. As a region you are at Level 0 because none of it stacks.
What this costs, let's look at an example
Assertions about seven-figure losses are easy to write and impossible to check. Here is a sum you can run against your own numbers instead.
Take one promotion, in one European market, across 4,000 stores. Say the incremental value of that promotion is £400 per store for the week it runs.
If compliance runs at the 90% you assumed, 400 stores miss it and you lose £160,000.
If it actually ran at 60%, 1,600 stores missed it and you lose £640,000.
The difference between what you believed and what happened is £480,000. One promotion. One market. One week.
Now run 12 promotions a year across eight European markets. You currently have no comparable way to tell which of those eight is the 60% market. That's the number worth arguing about internally. These figures are illustrative: substitute your own store count, your own incremental value and your own compliance assumption but overall the shape of the answer will not change.
And in some markets, one retailer isn't one retailer
There's a second problem underneath the first and this one hits your field team rather than your reporting.
Italy's largest grocery operator by share is Selex, at 15.84%, a figure Conad itself acknowledged when it confirmed second place at 14.84% in December 2025. Gruppo VéGé sits at 8.53%.
None of those three is a retailer.
Selex is a purchasing consortium of 18 separately owned member companies running 3,529 stores under a dozen different fascias. Gruppo VéGé is 31 associated companies across 3,605 stores. Conad is five co-operatives sitting above 2,125 independent retailer-owners.
So Italy's top three lines on a share table sit above 49 independently owned member companies plus more than 2,000 owner-operators. They pool national supplier negotiation and private label. They do not pool ownership, P&L, store estate, assortment, pricing, planograms, field teams or compliance standards.
The Dutch table does the same thing. Superunie appears as a single line at around a quarter of the market. It is a purchasing co-operative of 10 companies, including PLUS, Hoogvliet, Dirk, Vomar, DekaMarkt, Poiesz, Nettorama and SPAR Holding. Setting "Superunie 24.5%" beside "Albert Heijn 37.1%" implies both have one point of commercial control and one execution standard but only one of them does.
Here's why that costs you money rather than just confusing your reporting. Agree a planogram centrally with Selex and you have not agreed one plan. You've agreed a starting point that then lands in 3,529 stores run by 18 different companies with different shelf heights, different fresh operations and different staffing. A single compliance score for "Selex" averages 18 execution standards into one number and hides which of the 18 is failing. Your rep in Milan needs to know that, the consortium number cannot tell them.
Two kinds of data, both blind in the same place
It's worth being precise about what "measured" means here because the industry uses one word for two different things.
Syndicated and EPOS data tells you what sold. It's a census in modern trade, a sample in traditional trade. It arrives as a weekly average at least 10 days after the period closes. It cannot tell you what a promotion actually cost the shopper if the price changed mid-week. It cannot distinguish a BOGOF from a 3-for-2 and most importantly, it cannot tell you where in the store a unit sold from. A can scanning at the till looks identical whether it came off the gondola end you paid for or its usual facing three aisles away.
Field audits tell you what was in the store, at the moment someone stood in it. Better evidence, far smaller sample and by the time the report lands, the promotional window has usually closed.
Neither is wrong because both are the wrong tool for the two questions every European commercial leader is actually asking. Did the plan we funded happen? Can I compare the answer across my markets?
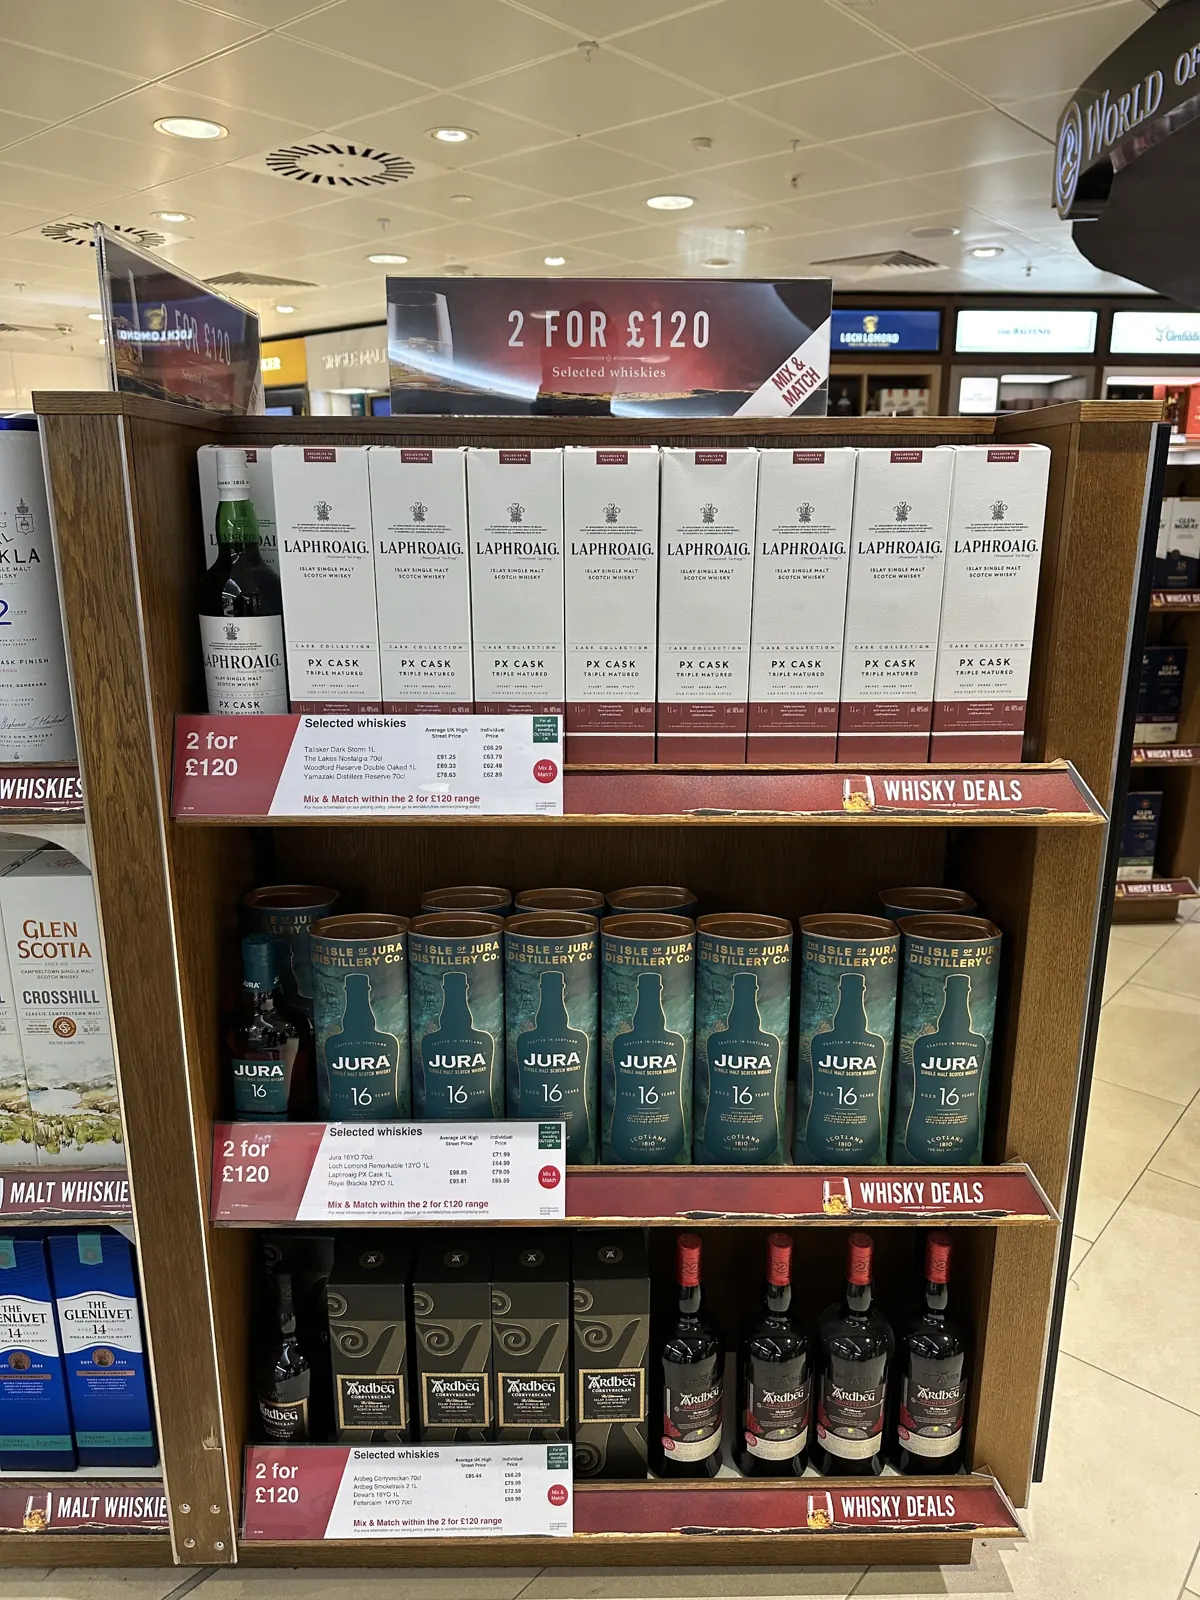
And the gap between them widens exactly where the money is. A large share of European trade spend is activated off the base planogram: gondola ends, front-of-store stacks, secondary sitings, queue-line and impulse fixtures. Those are the placements the sales data is structurally least able to see, the spend is specific but the read is not.
The rules change at every border, in law
Retailer structure is only half of it because what counts as correct execution is set locally, in law.
Germany. Under the Preisangabenverordnung, in force since May 2022, a deposit must be shown alongside the total price and may not be folded into it. It must also be excluded from the unit price calculation. Since 12 August 2026 the Verpackungsrecht-Durchführungsgesetz goes further: beverage bays require "EINWEG" or "MEHRWEG" signage placed in immediate proximity to the packaging. That signage must be at least equal in form and font size to the price label for that product.
Ireland. Section 22 of the Public Health (Alcohol) Act 2018, operative since November 2020, requires alcohol in mixed retail to sit behind a physical barrier of at least 1.2 metres through which it is not visible, or in enclosed units no more than 2.2 metres high, or in no more than three adjacent units each no wider than one metre. Separately, regulations in force since January 2021 ban multibuy and linked-purchase discounts on alcohol outright. They also ban any price promotion lasting three days or less.
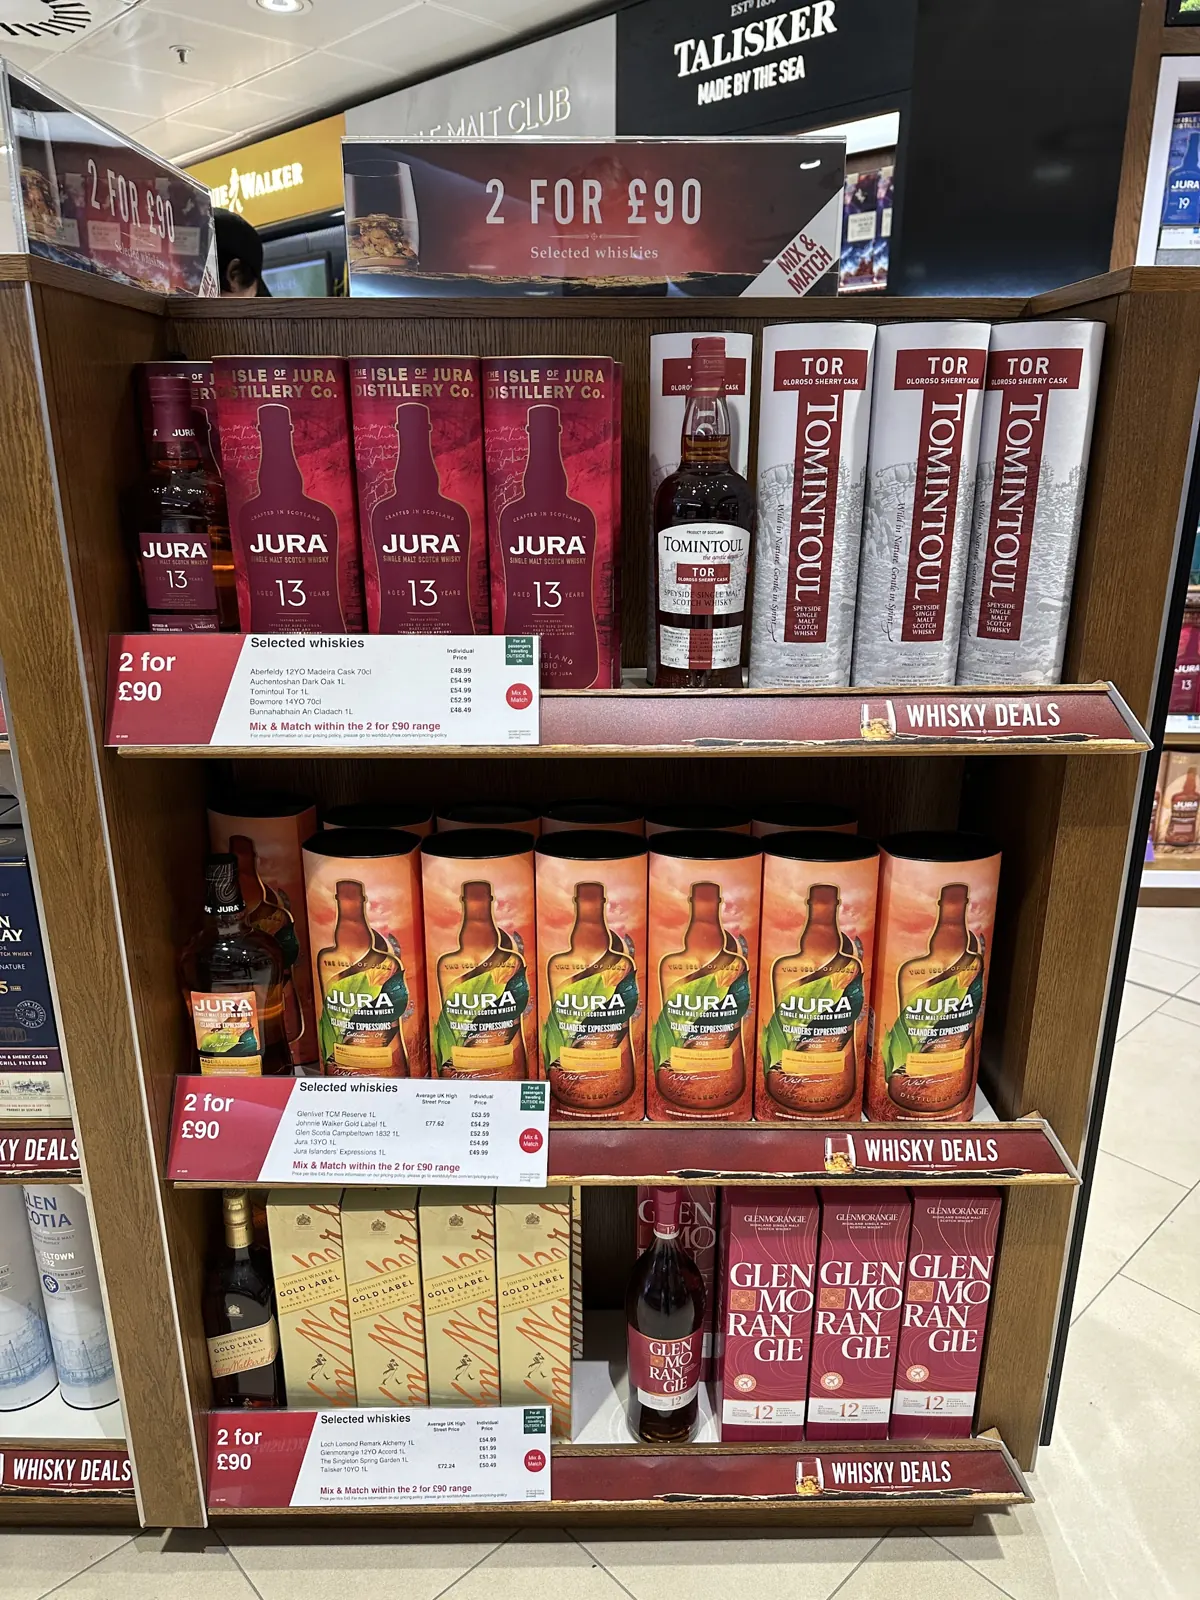
France. Promotional depth on food is capped by law at 34% of the consumer selling price, alongside a 25% cap on the volume that can be promoted. A mechanic that is routine in Britain or the Netherlands is unlawful in France.
So the uncomfortable conclusion, rarely stated: a single pan-European planogram and a single price-ticket template are non-compliant somewhere by definition. Not by accident but by construction. Execution teams already know this and handle it through local exceptions, local sign-off and local reporting which is exactly what makes the comparability problem worse.
Private label narrows the space further by a different amount in every market. Across 17 European countries private label reached 38.8% of grocery value at MAT W52 2025 (NielsenIQ, published in PLMA's A Mosaic of Markets 2026 report). Eight of those markets are above 40%. Switzerland is highest at 52.3%, Norway lowest at 23.6%. Private label grew value at 4.1% against manufacturer brands at 2.7%. It outgrew brands in 12 of the 17 countries. The fixture you are competing for is smaller than the shelf and it's also a different size behind every border.
What good actually looks like
One measurement standard, applied locally, read centrally. Not one planogram for Europe. One consistent way of measuring whether the local plan executed, so that Italy and Sweden produce numbers that mean the same thing even though the plans behind them do not. Three things have to be true for that to work.
The recognition layer has to hold up in your messiest market, not your cleanest. Holding accuracy across one market is straightforward. Holding it across 30 means shelf-edge labelling in more than 20 languages, price tags, national pack variants of the same SKU and store environments running from a Nordic hypermarket to a Southern European kiosk. Accuracy is the cornerstone, not the ceiling, because everything downstream sits on it.
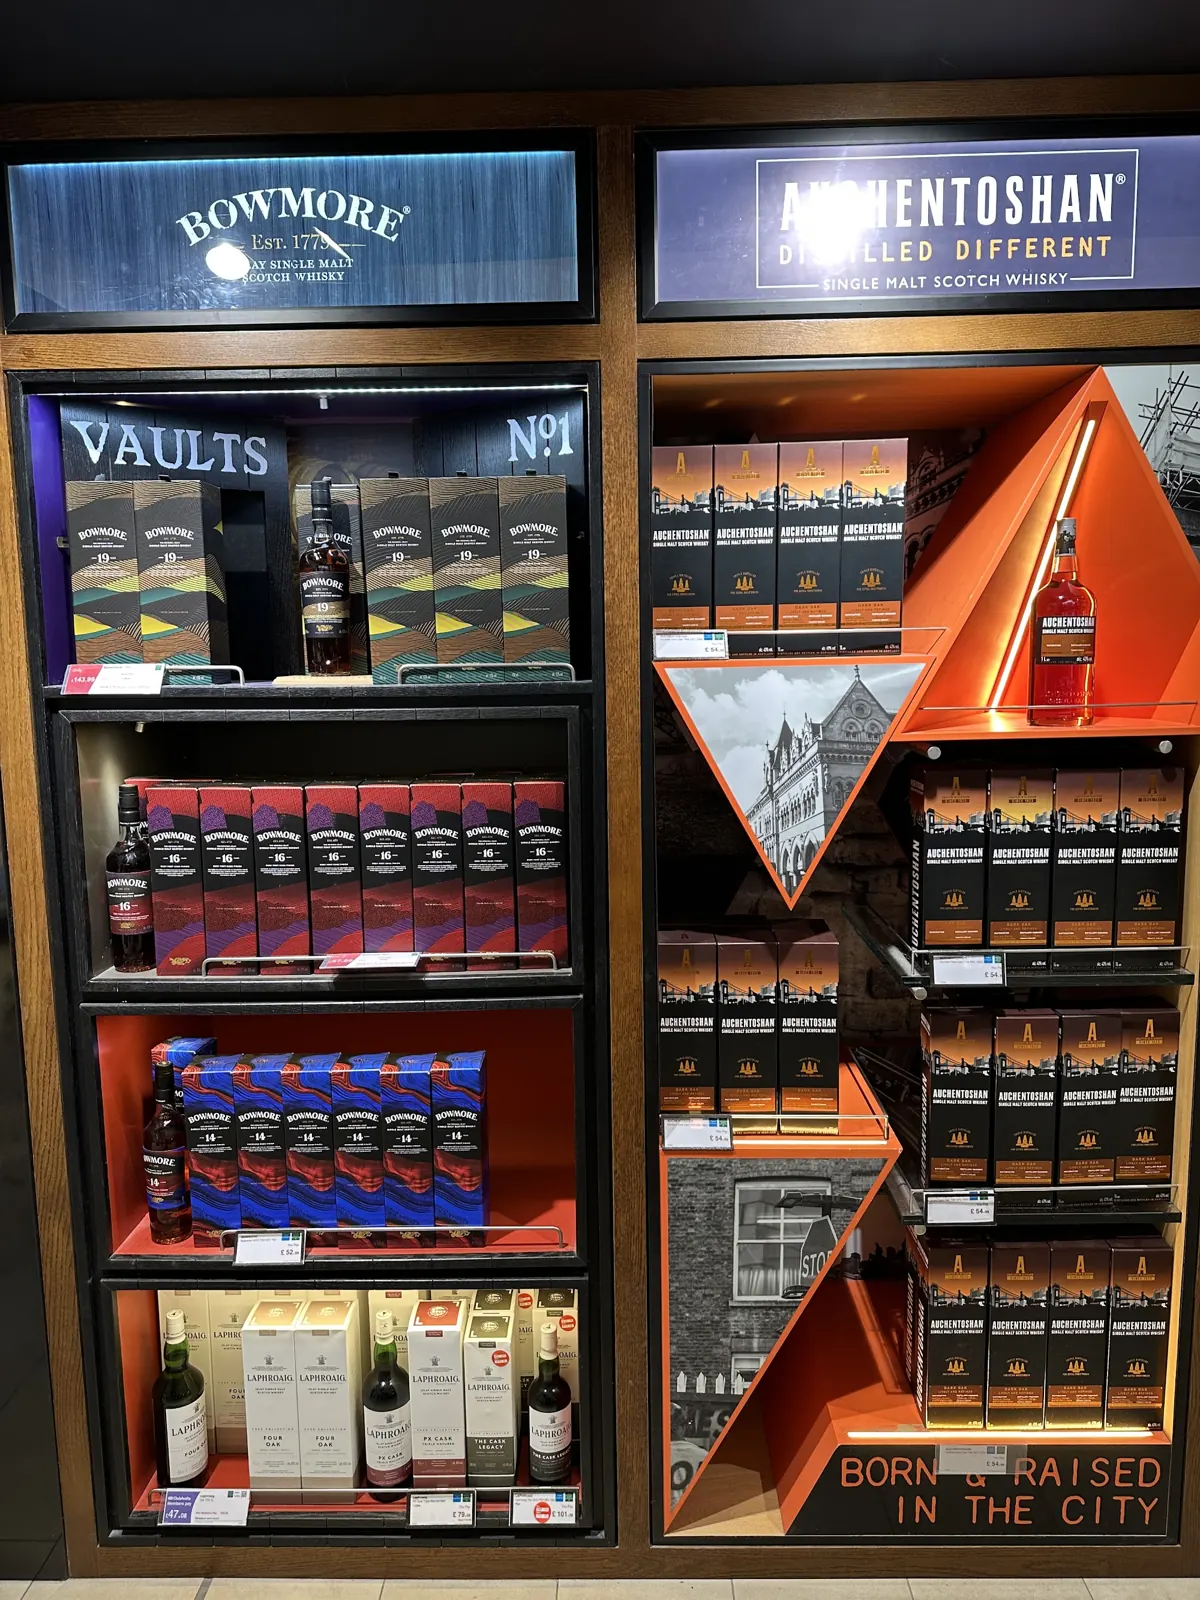
It has to cover the store, not just the base shelf. Displays are where a large share of the trade money goes. A standard that only reads the base planogram is measuring the cheaper half.
And it has to end at the rep, not at a report. The point is not that head office gets a comparable dashboard next month. The point is that the person standing in the aisle in Milan gets the gap, the reason and the next action while they are still in the store and the promotional window is still open. Comparability is what lets you rank markets. Action at the shelf is what recovers the money.
On coverage, one caution. The goal is never every store. That's uneconomic and everyone in this industry knows it. The goal is widening the universe intelligently so that each visit is faster, evidence comes from outlets a rep would never reach and field time goes where a human is genuinely needed.
A note on our previous piece, The Execution Gap: why it looks different in every market, which described European grocery as highly concentrated with independents as a small residual. That is true of most European markets but we need to be mindful that it's not true of all of them. Concentration in Europe is a national characteristic, not a continental one.
You cannot close a gap you cannot see and in Europe, you also cannot close one you cannot compare.
Our The Execution Gap: 2026 Execution Intelligence Guide brings the full picture together: what the gap costs, why month-old audits keep missing it and what closing it looks like across shelf visibility, promotions and pricing.
Download the guide →
FAQ
Why is there no single European grocery market share table?
Because every market publishes a different kind of number. Britain, Ireland, Spain and France have household panel shares from Worldpanel by Numerator, measuring what shoppers actually spent. Finland, Sweden and Norway publish roster-based figures built from the combined turnover of a named list of operators which sum to 100% by construction. Germany publishes a revenue ranking and no free panel share. The Netherlands has a panel, but the provider lacks permission to publish six banners. The figures are all real and valuable in their own right, but they're not comparable.
Why does a purchasing consortium make execution harder to measure?
A consortium is a group of independently owned retailers that pool supplier negotiation and private label but nothing else. Selex, Gruppo VéGé, Conad and ADM in Italy and Superunie in the Netherlands all appear on share tables as single lines. Selex alone is 18 separate companies across 3,529 stores. A planogram agreed centrally still has to be executed by every member company separately so compliance has to be measured that way too.
European grocery is modern and well measured. So why is execution still hard?
Because measurement is national and execution reporting is local. Different retailers, planogram definitions, compliance definitions, capture methods, reporting cycles and field agencies in every market. Every country produces a number. Head office receives an average of measures that were never comparable which is not a signal.
Why does comparability matter more than measurement?
Because trade investment gets allocated by market size, since market size is the only variable head office can compare with confidence. It should be allocated by where the execution gap is widest and without comparable data nobody can tell the difference.
What can syndicated and EPOS data not tell me?
Where in the store a unit sold from. A product scanning at the till looks the same whether it sold from the display you funded or its usual shelf facing. Sales data also arrives as a weekly average at least 10 days after the period closes. It can't distinguish promotional mechanics such as a BOGOF from a 3-for-2.
Who should read this?
Sales operations, RGM, trade marketing and supply chain leaders with multi-market European responsibility, measured on revenue growth, margin improvement or cost reduction.
Sources
- Great Britain and Ireland: Worldpanel by Numerator, GB Grocery Market Share and Ireland, 12 weeks ending 9 August 2026
- Spain: Worldpanel by Numerator, first half 2026, via foodretail.es
- Finland: Päivittäistavarakauppa ry, Finnish Grocery Trade Statistics 2025, published June 2026
- Sweden: DLF and Delfi, Dagligvarukartan 2025 (2024 data)
- Norway: Konkurransetilsynet, Dagligvarerapport 2025, published April 2026
- Germany: Lebensmittel Praxis Top 30 (NIQ Trade Dimensions, 2025); Bundeskartellamt on the big four; Bundestag Wissenschaftliche Dienste WD 5-120-24, 27 September 2024
- Netherlands: Circana full year 2025, via FoodPersonality and Distrifood; Superunie membership
- Italy: Conad year-end release, 18 December 2025 (ANSA); Gruppo VéGé FY2025 results and associated companies; Conad structure
- Private label: NielsenIQ for PLMA, A Mosaic of Markets: PLMA's 2026 Report on the Status of Private Label Across Europe, MAT W52 2025
- Germany regulation: Preisangabenverordnung § 7; Verpackungsrecht-Durchführungsgesetz § 47
- Ireland regulation: Public Health (Alcohol) Act 2018 s.22; S.I. No. 4/2020
- France regulation: Loi n° 2025-337 du 14 avril 2025, amending the promotional caps under Loi n° 2020-1525

Related Resource


.svg)
Get the latest Execution Intelligence news and resources direct to your inbox
Industry insights, retail intelligence and field-tested execution playbooks, so you always know what's happening in store.
.png)

.svg)

© 2026 Neurolabs. All rights reserved

